Thursday 26 January 2012

Cost-Benefit Table & Breakeven Table


This is the group's Cost-benfit table. This table helps show and present how each or some of the component in our project benefit the project itself. It helps one sees the importance of each component as well as do the appropriate measures for each component.
As we see the cost-benefit ratio, if the ratio is less than 1, it means the cost is more than benefit, which makes it unworthy to purchase as this ratio is taken from benefit divided by cost.
We also includes a breakeven table, which will show one how much the company got to earn inorder to earn back the money spent in the project, and hence profit from it.
The cost benefit table also showed depreciation per month on certain equipment and project labour. this will allow us to better calculate the benefit it brings after completing the project.

Costing of the Project

We breakdown the costing into four main factors. These are as follows :
Materials
Materials can be considered as the most important factor when planning for the project, As said, A war cannot be won without the guns and stuff. Materials to the whole project is as important as the veins to a human.
Equipment
Equipment Refers to the machinaries used for the project, Example the bull dozers and cranes which will speed up the whole progress of the project.
Labour force
Labour force refers to the workers, the foreign Talents and Foreign workers. Without them, the project would not be progressing smoothly, hence we are hiring 100 workers for this project.
Location
Lastly we have to rent for the location whereby the Project is to be carried out.

Thursday 12 January 2012

Updated AON Table

This is the updated version of the AON table
 taking into the consideration an event P comes right after O. If happened to be that, after event O takes place and time is lacking, P requests for more time. A period of 16 Weeks. ( Adrian)

Risk assessment

Hydro

Road

The risk assessment helps decrease the possibilities of the possible accidents that may happen during the whole project. These assessment also teaches the workers how to act if such accidents happen.
"Preventing an accident is 100 Times easier than doing the after works of an accident."  

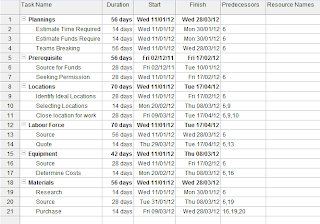
Gantt Chart


Gantt Chart. The Gantt Chart is a very powerful tool to help assist the group to make sure the project is completed within time limit. Additional to that, if any of the events got delayed, we could easily calculate the effect on the Latest completion Time.